Use the Process explorer app
With the Process explorer, you can analyze the sequence of activities within your business processes. You can use the Process explorer to clearly display and evaluate the process structure and the relationship between the activities.
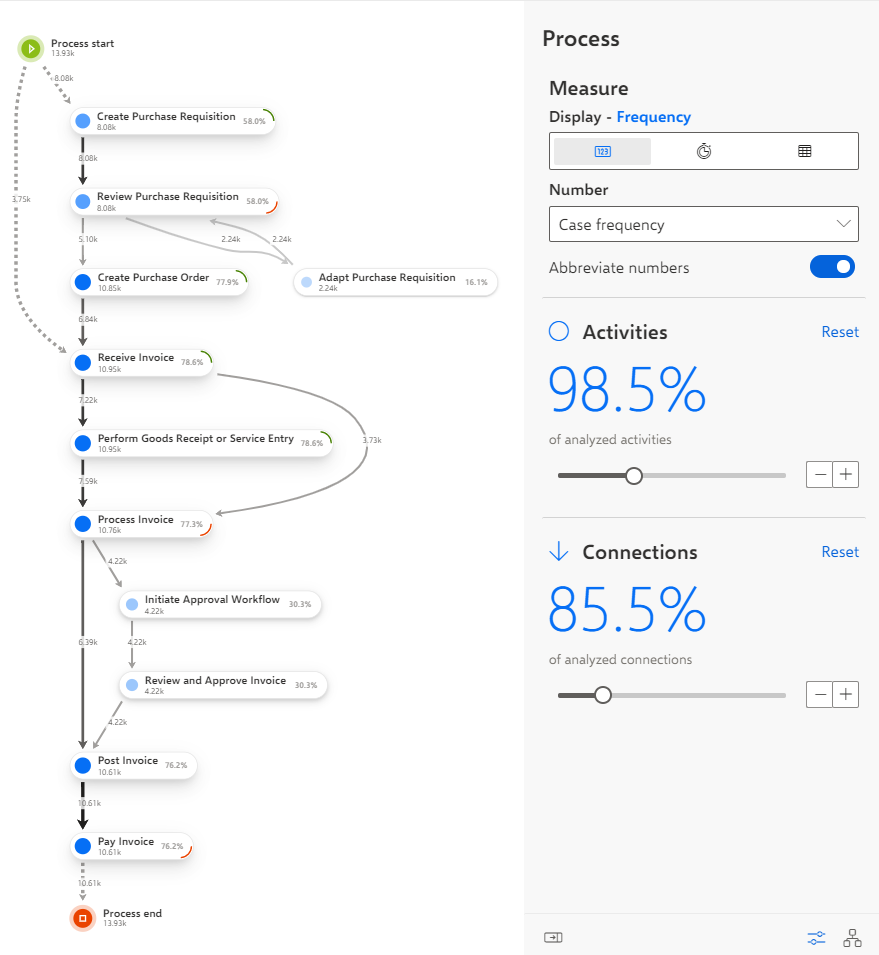
A process starts with the Process start node and ends with the Process end node. The individual nodes are connected with arrows, which are labeled with the corresponding measure values configured in the Process panel. The values displayed in the nodes and connections are aggregated values (by default, the average value (AVG)).
Connections from the Process start or to the Process end node are shown as dashed lines. The stronger the color of a connection, the higher the value of its measure. You can identify the most frequent connections directly by their color. The behavior for nodes is similar. The stronger and larger the circle, the higher the value of its measure.
The process graph initially shows the most common path. That means it shows the activity flow that occurs most frequently. You can configure and extend the process graph using the Process panel. The Variants panel allows you to analyze the different process variants.
The following graph shows an extended process that includes 98.5% and 85.5% of all activities and connections, respectively. The numbers on the connections show the values of the configured Case frequency measure.
The Process explorer is a predefined app and provided by default. For details on adding the Process explorer app to an analysis, see the chapter Add an app to an analysis.